Grafieks Real-time Analytics: Stay Ahead with Real-Time Data Intelligence
-
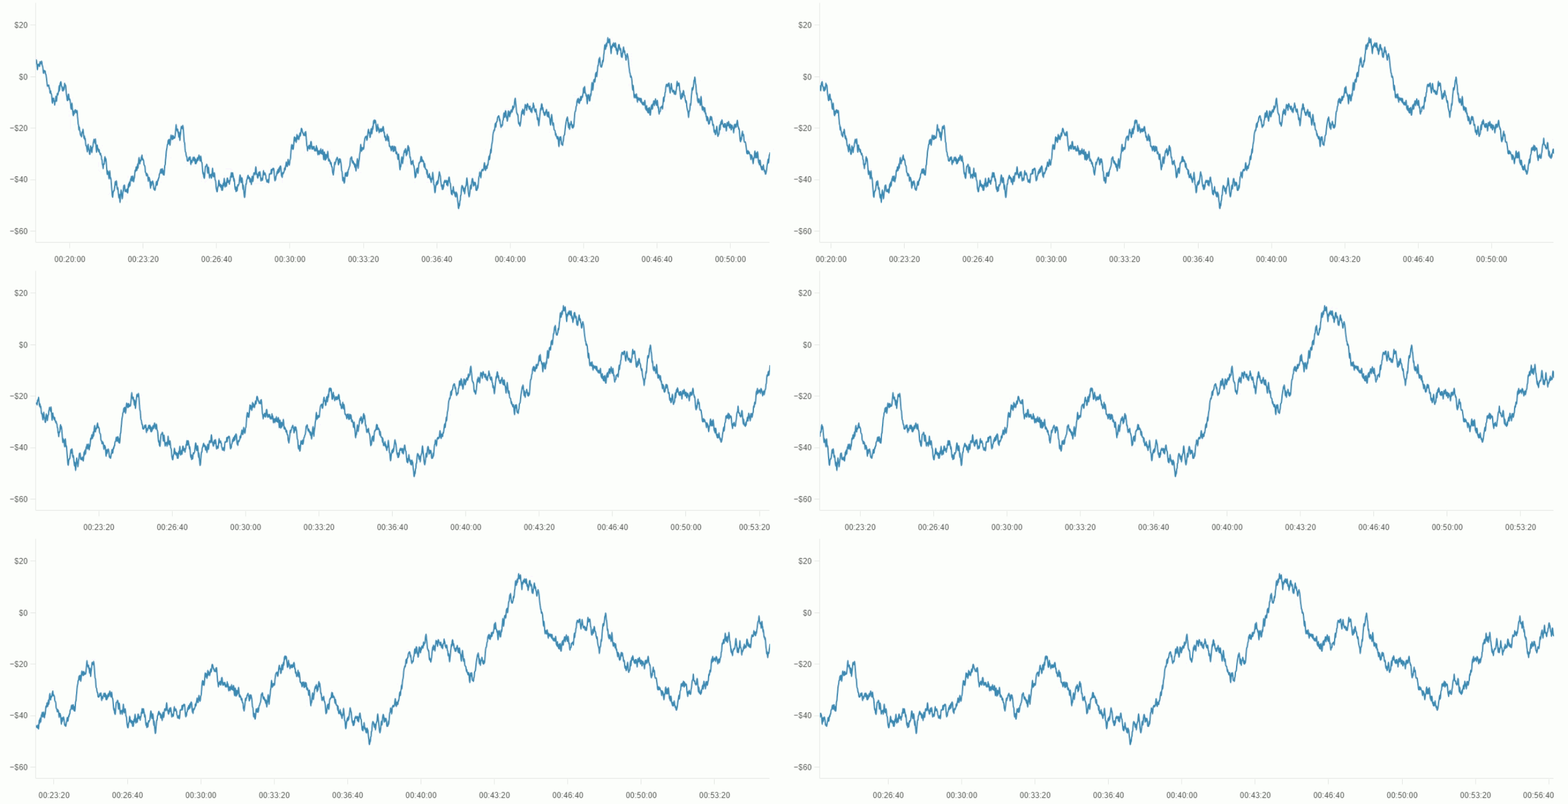
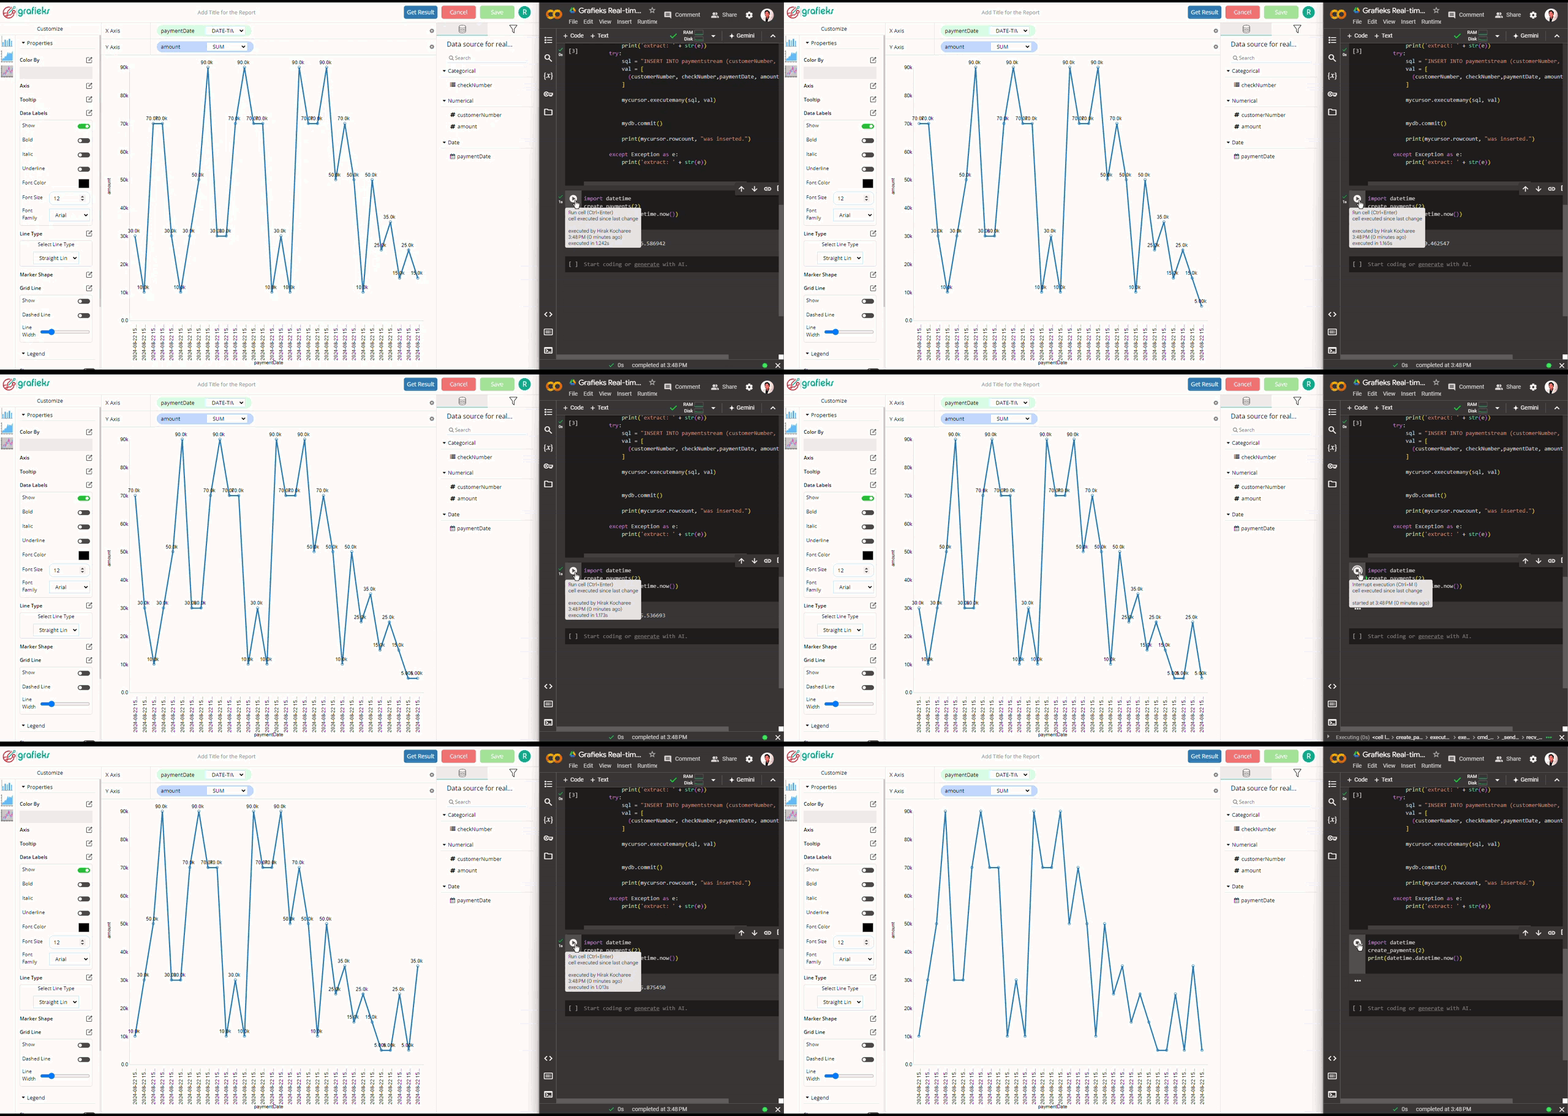
Whether it's website traffic, user behavior, or sales data, you can create dynamic reports, and dashboards that update in real-time, providing a live view of your data.
-
Compare real-time data with historical data to identify trends and anomalies, helping you make data-driven decisions based on historical context.

Application Performance Monitoring
Track key metrics and system performance in real time to identify and resolve issues before they impact users.
Customer Behavior Analytics
Monitor user interactions and behaviors on websites or apps in real time to improve engagement, personalize offers, or optimize customer experience.
Operational Efficiency Monitoring
Track production lines, logistics, or inventory in real time to optimize efficiency, minimize downtime, and quickly address issues.
IoT Device Monitoring
Collect and analyze data from IoT devices (e.g., sensors, smart appliances) to identify trends, optimize usage, or respond to device conditions in real time.
Use cases
-
Connect, ingest, and see reports in near real-time.
-
Accelerate decision-making with immediate access to the latest data trends.
How it works?
Experience the power of real-time data streaming at your fingertips, fueling instant insights and informed decisions.
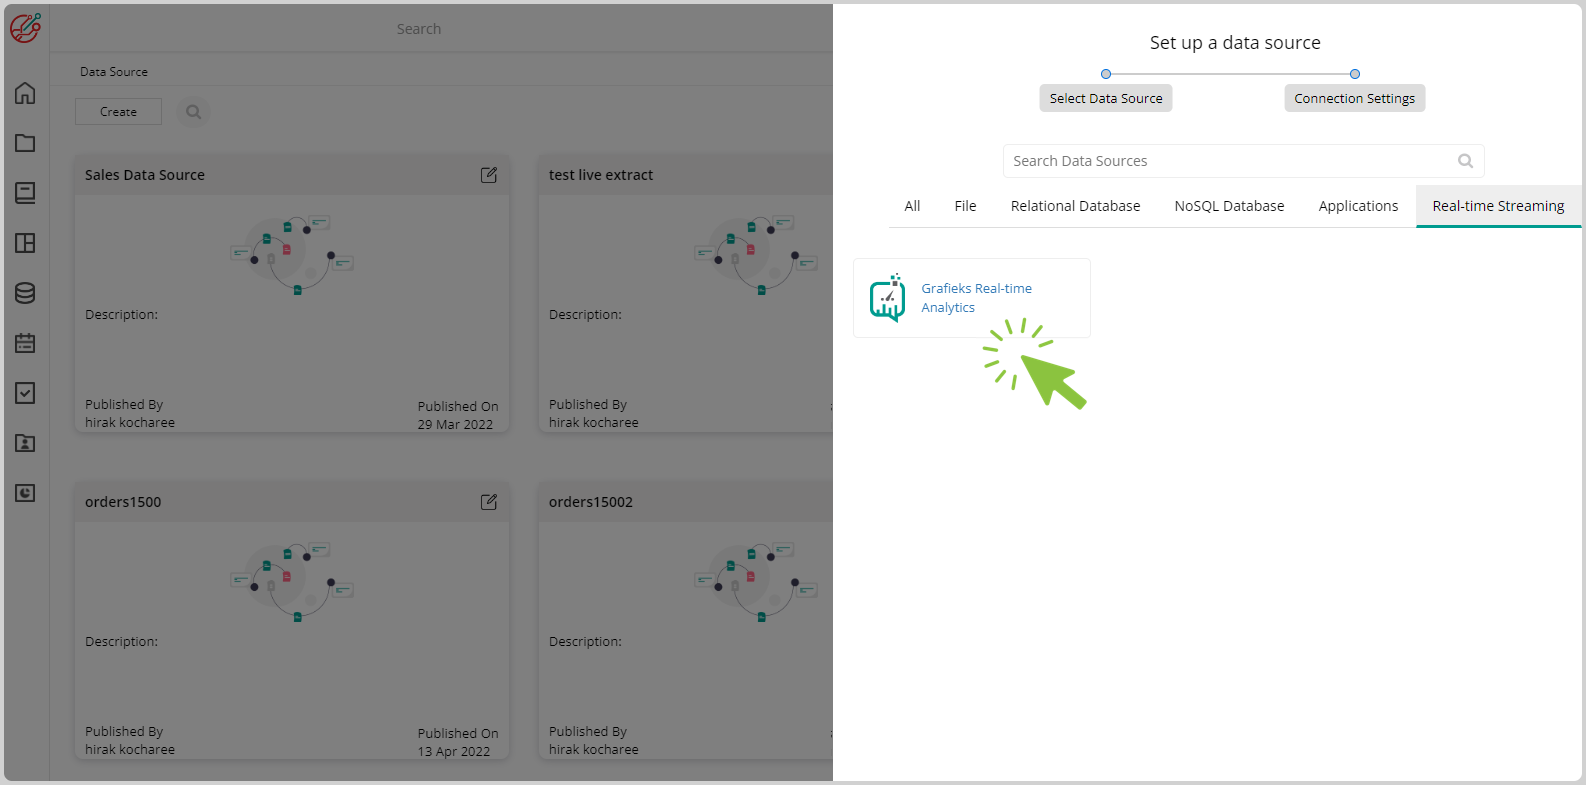
Connect to streaming connector
Grafieks Real-Time Analytics connector only consumes the latest data without the need to store historical data.

Prepare Your Data Effortlessly
-
A user-friendly visual data modeler that enables table selection without the need for prior SQL expertise.
-
For those who enjoy crafting SQL, Grafiek Desktop's SQL editor seamlessly integrates with your expertise.

Visualize, analyze and explore
-
Empower your business with the latest data and make informed decisions with real-time analytics.
-
A seamless user experience that empowers you. It's easy, it's intuitive and it works!

Design, Customize, and Analyze with Dashboard Builder
-
Customize layouts, colors, and data visualizations effortlessly to convey your insights effectively.
-
Dive deep into your data, perform real-time analysis, and gain actionable insights to drive informed decision-making, all within the convenience of your custom-designed dashboards.

Grafieks Real-Time Analytics pricing
No upfront cost
"No upfront cost" doesn't just mean affordability; it means lowering the risk. You can take the leap, explore new possibilities, and test the waters without a substantial initial investment.
No termination fees
Life is dynamic, and your needs can change. With no termination fees, you have the freedom to adapt our services as your circumstances evolve.
Pay only for what you use
Say goodbye to unused capacity that sits idle and drains your budget. With our model for Grafieks Real-time Analytics, you'll only pay for incoming and outgoing traffic, making your financial management more efficient than ever before.
Never any hidden costs
When you choose Grafieks, rest assured that you'll never encounter any hidden costs. We believe in straightforward pricing, so you can confidently plan and budget for your business without any surprises.
Getting Started is Fast & Easy
Free, no-commitment trial
Easy for everyone—no SQL required
Up and running in 5 minutes

